Excel - Intermediate for Visual Representation and Data Analysis
Descriptor: Learn to use some of the more advanced features and functions in Microsoft Excel 2013/2016 in this hands-on workshop. TN State standards include data interpretation by students in a variety of ways. This training is designed for those participants who have previously attended Basic Excel and are ready to learn how to create tables and build a basic database, use conditional formatting to filter grades by color, protect worksheets and workbooks, go a step further in chart creation and insert them in to PowerPoint Presentations. Participants will learn how to use concatenate, text to columns, and find and replace, which are valuable tools for data analysis. Lastly participants will learn how to create an Excel Survey and collect data for analysis.arts in PowerPoint.
Focus Area: CE, CM, CS
Inservice Credit: 1.5 hrs
TEAM Strand: CCSS Math, CCSS ELA, and Literacy/Science/Technology, Planning- Use of Data
ISTE Standard for Students: Collect data or identify relevant data sets, use digital tools to analyze them, and represent data in various ways to facilitate problem-solving and decision-making
ISTE Standards for Teachers: Model and facilitate effective use of current and emerging digital tools to locate, analyze, evaluate, and use information resources to support research and learning
Digital Citizenship Component: Privacy

|

|
The Four PLC Guiding Questions
- What is it we want our students to learn?
- How will we know if each student has learned it?
- How will we respond when some students do not learn it?
- How can we extend and enrich the learning for students who have demonstrated proficiency?
| excel_workbook_for_pd.xlsx |
Before we begin, please download the Excel Workbook for PD. All tasks will be completed in this workbook.

Task
Creating
a Table for Test Data |
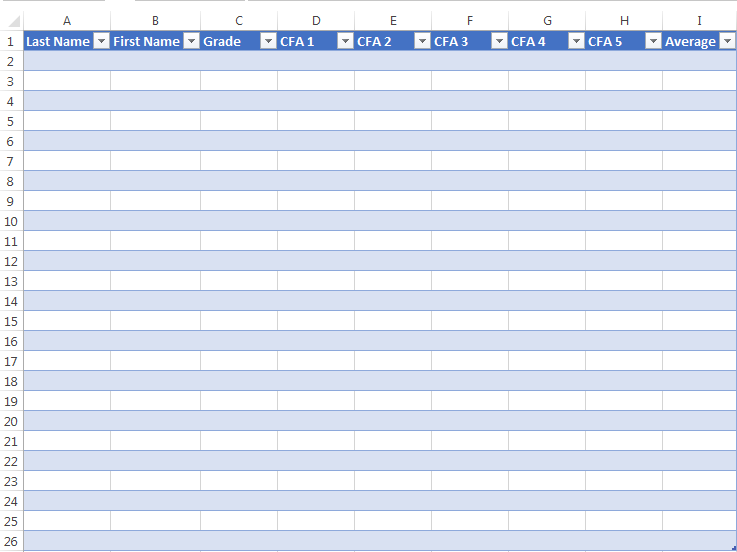
In the Table Sheet Worksheet Tab, create a table using the range A1:H26.
You only have to click on the cell to change the text, click and start typing.
|
Your table should look similar to this:
|
|

Task
Copying and Pasting Test Data from Worksheet to Another
|
Your table should look something like this:
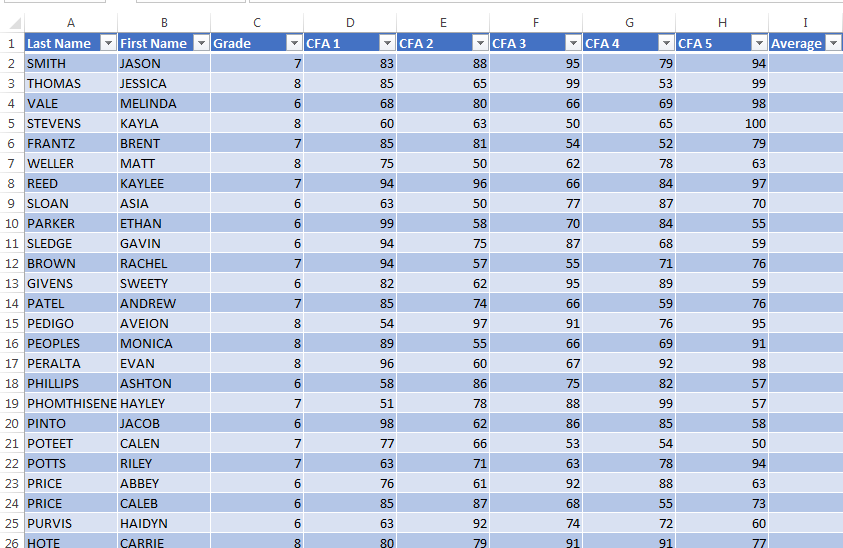
You may want to now add borders to your table.

Task
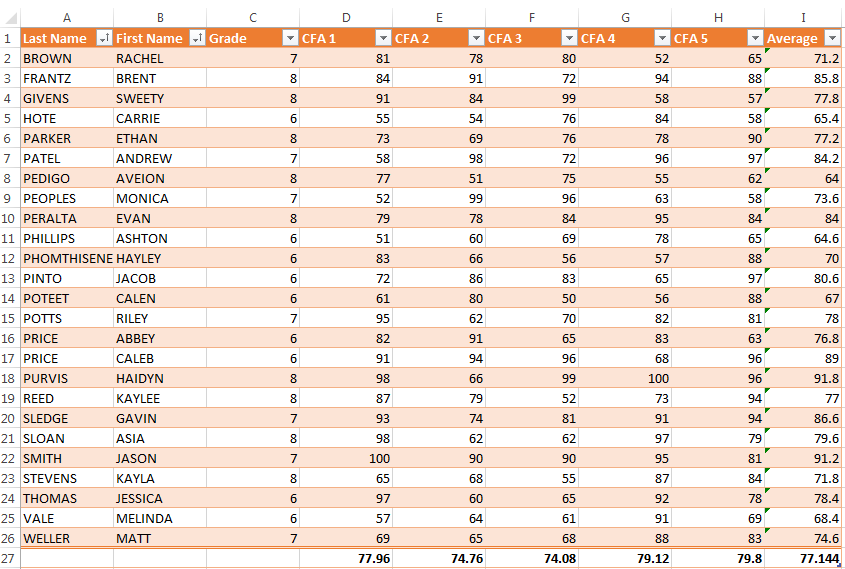
Averaging Individual Student CFA Scores and Finding Class Average of Each CFA
|
|
Your table should look something like this:
|

Task
Conditional Formatting
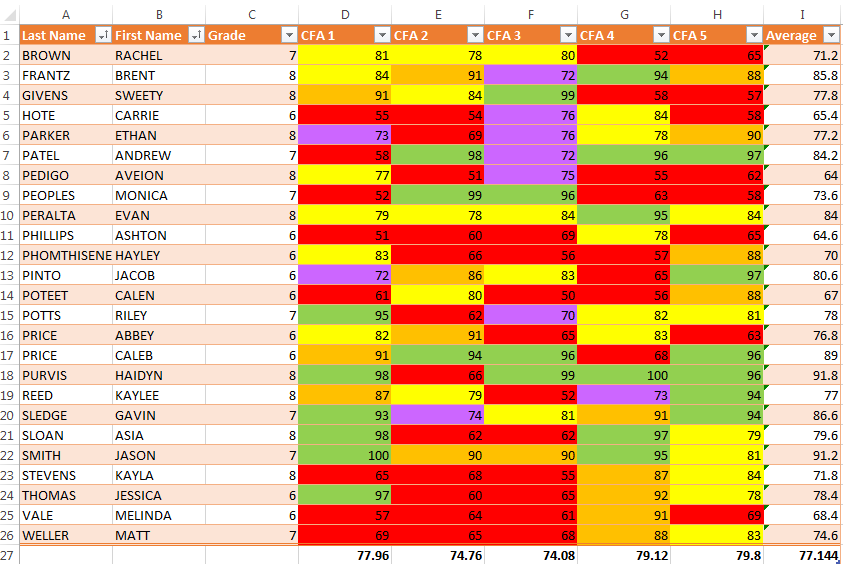
(Changing Cell Color to Match Score Range) |
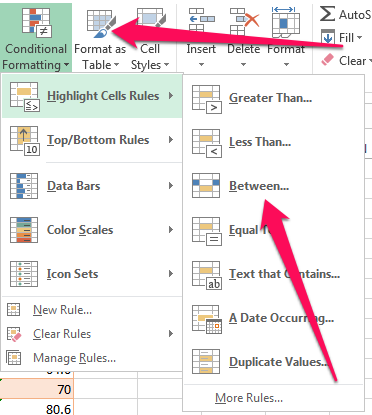
- Enter 1 and 69.9
- Choose the drop down arrow next to "With" and Choose Custom Format and select the Fill tab and choose Red
With the same range highlighted, create the same cell rules using the following criteria
- 70-76.9 Purple fill
- 77-84.9 Yellow Fill
- 85-92.9 Orange Fill
- 93-100 Green Fill
Your table should look something like this:
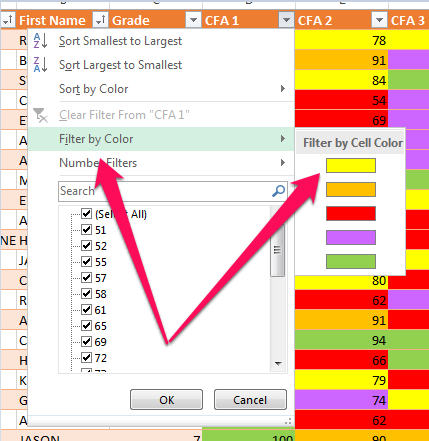
- Click on the arrow down in CFA 1 cell. Filter CFA 1 and choose Filter by color and choose Yellow. This filters kids by color which is related to the scores. Filter to yellow pulls any students who made an 84.9 and lower.
- Practice filtering by other colors.
- Lastly, turn off all filters to show all data again by clicking the CFA 1 Filter again and select Clear Filter from CFA 1

Task
Protecting Sheets and Workbooks
|
FYI...
Protect Sheet – only protects the current sheet but others can still be editedProtect Workbook – All sheets can be edited once the workbook is unlocked
|
Right click on the Tab Sheet tab and notice how you can pick and choose what users are able to do with the worksheet once it is protected.
|
Combining two columns into one column, ex. Student first and last names
|

Task
Using Intermediate Formulas to Save Time on Task
|
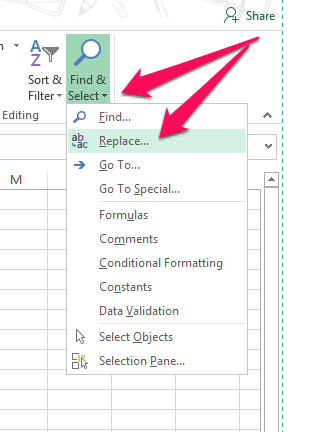
- Highlight the F column by clicking on F at the top of the column
- Type in @rcschools.net for Find What
- Type in a space and your school initials for Replace (example - OMS)
- Then choose Replace All
- Highlight the column you wish to split, for this exercise, highlight column H
- Go to the Data Tab in the Ribbon and click on Text to Columns
- In the popup window, we will leave it Deleminated because of spaces between the first and last name in the column
- Click Next
- Choose Space
- Click Next
- Then Finish

Task
Using an Excel Survey in Office 365 to Collect Data
|
|
